Know what's working
Track views, starts, completions, and drop-offs, key insights, underlying patterns, and more in real-time. See exactly how your forms perform and where to optimize.
Why form analytics matter
Creating forms is only half the battle. Understanding how they perform is what drives improvement. Formsuite's analytics reveal exactly what happens from the moment someone sees your form to the moment they submit, helping you identify friction and optimize for maximum conversions.
See the full funnel
Track every step: views, starts, completions, and everything in between. Know your true conversion rate, not just how many submissions you got. Understand how many people saw your form but never started.
Find the drop-off points
Pinpoint exactly where users abandon your forms. Is it a specific question? A particular step? A confusing field? Analytics show you precisely where friction exists so you can fix it.
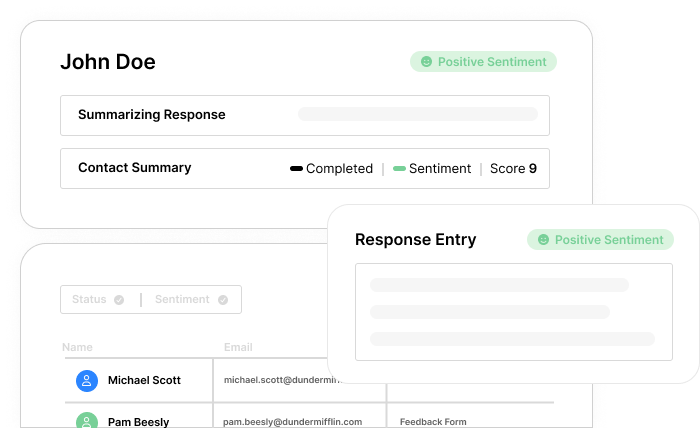
Measure what matters
Beyond basic counts, track time to completion, device breakdown, traffic sources, and more. Get the context you need to understand not just what is happening, but why.
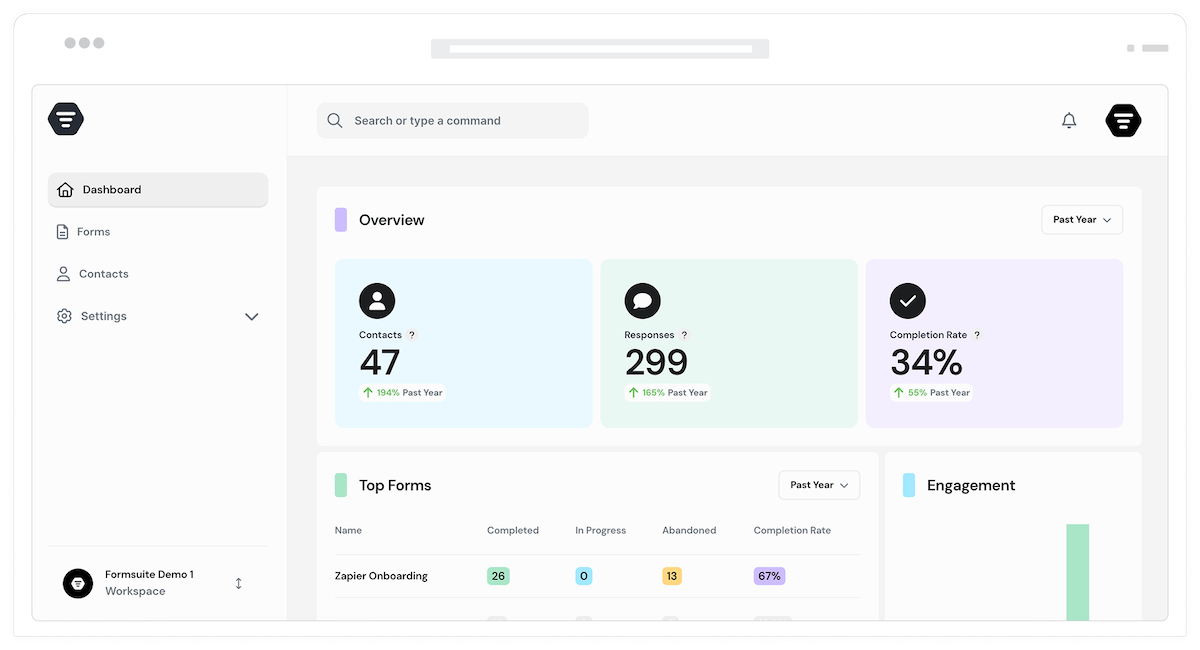
Insights at a glance
Your analytics dashboard puts critical metrics front and center. No digging through data, no complex reports to build. Open the dashboard and immediately understand how your forms are performing.
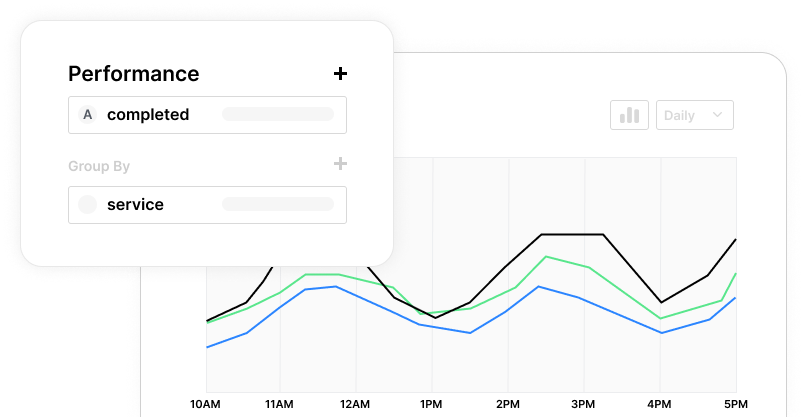
Real-time performance metrics
Watch views, starts, and submissions update in real-time. See spikes when campaigns launch, dips when something breaks, and trends that develop over time. Your dashboard stays current as responses flow in.
Conversion rate tracking
Calculate true conversion rates from view to submission. Compare performance across forms, time periods, and traffic sources. Set benchmarks and track improvement over time as you optimize.
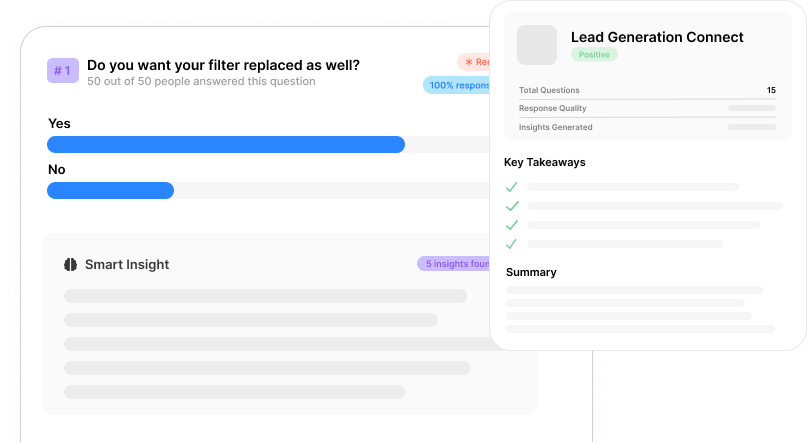
Question-level analytics
Drill into individual questions to see which ones cause the most drop-offs. Identify confusing wording, difficult fields, or unnecessary questions that hurt completion rates. Optimize at the question level.
Visual reports
Charts, graphs, and visualizations make data easy to understand and share. Export reports for stakeholders, track progress toward goals, and communicate performance clearly to your team.
View and start tracking
Know how many people see your form versus how many actually start filling it out. This critical metric reveals whether your form placement, design, or first impression needs work.
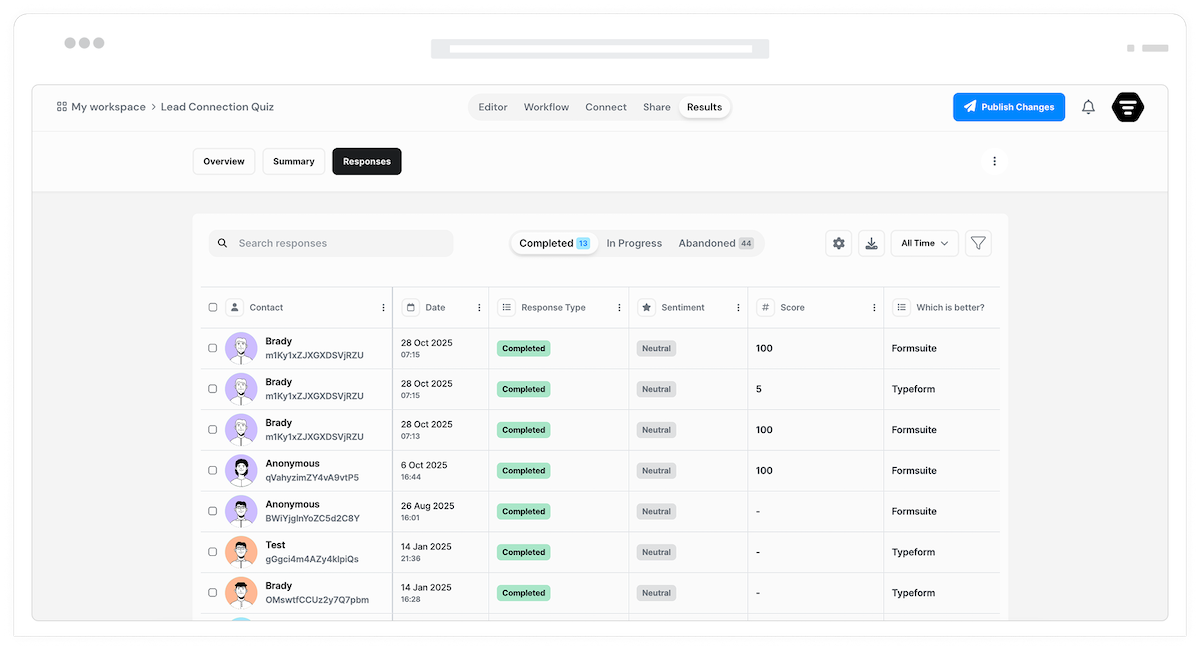
Completion rate analysis
Track the percentage of users who finish your form after starting. Compare completion rates across different forms, time periods, and user segments to identify what works best.
Abandonment tracking
See exactly which questions or steps cause users to leave. Identify patterns in abandonment by device type, traffic source, or time of day. Target your optimization efforts precisely.
Traffic source attribution
See where your form traffic comes from. Track UTM parameters, referrer URLs, and campaign sources. Measure which marketing channels drive the highest quality form submissions.
Frequently Asked Questions
Everything you need to know about form analytics and performance tracking. Questions about specific metrics? Our team can help.
Still need help? Contact Us
Formsuite tracks comprehensive metrics including total views, form starts, completions, completion rate, abandonment rate, drop-off by question, average completion time, time per question, device breakdown, browser information, geographic location, traffic sources, UTM parameters, and referrer URLs. These metrics give you a complete picture of form performance from first impression to final submission.
Completion rate is calculated as the number of form submissions divided by the number of form starts, expressed as a percentage. For example, if 100 people start your form and 65 submit it, your completion rate is 65%. We also track view-to-start rate and view-to-completion rate for a fuller funnel view.
Yes, question-level analytics show exactly where users abandon your form. You can see the drop-off rate for each question or step, identifying friction points that need attention. This data helps you pinpoint specific questions that cause confusion or hesitation, enabling targeted improvements.
Use UTM parameters in your form URLs to track campaign performance. Formsuite captures utm_source, utm_medium, utm_campaign, and other parameters, storing them with each submission. Analytics dashboards let you filter and compare performance by campaign, showing which marketing efforts drive the most and highest-quality submissions.
Yes, date range filters let you analyze any time period. Compare this week to last week, this month to last month, or any custom date ranges. Track trends over time to see if changes you make improve performance and identify seasonal patterns in form engagement.
Basic analytics including views, submissions, and completion rates are available on all plans including the free tier. Advanced analytics like question-level drop-off analysis, detailed time metrics, and extended data retention are available on Pro and higher plans. Check the pricing page for full details on plan features.
Analytics update in real-time. Views, starts, and submissions appear immediately in your dashboard. Aggregate metrics like completion rates and averages recalculate continuously as new data arrives. You can watch performance metrics update live during campaign launches or high-traffic periods.
Templates to get you started
Start from a ready-made template and customize it to fit your needs.

Customer Effort Score (CES) Survey
Measure how easy it is for customers to interact with your product, and use those insights to reduce churn and strengthen loyalty.

Lead Generation Survey
Discover where your best leads are coming from and identify which marketing channels are driving the strongest results.

Market Research Survey
Uncover valuable insights about your audience and sharpen your product-market fit with clear, actionable data.
Optimize your entire form strategy
Analytics work best alongside other Formsuite features. Combine insights with action.